Bitcoin(CRYPTO: BTC) soared to an all-time high of $106,182 per coin in January. With the fourth Bitcoin halving firmly in the rearview mirror and a more crypto-friendly regime in the White House, the original cryptocurrency looked ready to skyrocket like it did in 2020 and 2017.
But it hasn’t worked out that way. Bitcoin is down to $79,200 as of this writing on April 8. That’s a hair-raising 25% price crash, well ahead of the S&P 500(SNPINDEX: ^GSPC) stock market tracker’s 19% drop.
Is this the start of a three-year crypto winter like the one you saw after the 2017 peak, or is it a temporary pullback like in the spring of 2021? Nobody knows for sure, but here’s how I look at the Bitcoin situation today.
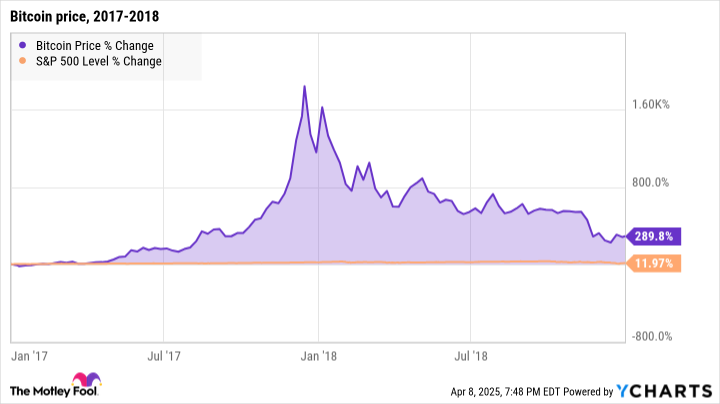
Bitcoin has a long history of extreme volatility. The oldest cryptocurrency swung from $785 per coin at the start of 2017 to $19,345 in mid-December. About one year after that, it ended 2018 at $3,880 per coin. The S&P 500 gained a modest 12% over that period, which looks like a horizontal line by comparison:
The recent price swings are actually quite modest from a historical perspective. The cryptocurrency’s daily standard deviance is about 2.7% in 2025. This volatility measure was twice that size in 2017 and just astronomical in 2009 and 2010:
Data source: Coin Codex. Chart by the author.
Past performance is no guarantee of future results, but this volatility chart shows a couple of helpful trends.
Bitcoin’s volatility tends to rise and fall in the same four-year cycle as the underlying halving process. Things calm down during each crypto winter, followed by a sharp spike in the year after each halving event. As a reminder, the fourth halving took place in April 2024. Bitcoin may be due for a much more volatile price chart in 2025.
The current year-to-date volatility is comparable to last year’s, which was one of the least fickle years in Bitcoin’s history. The price swings over the past week or so should boost the volatility rating, especially if the wilder changes continue.
This chart lumps price jumps together with price drops as a single value. But there is a certain mountain-like shape to Bitcoin’s cyclical tendencies, with game-changing jumps typically followed by a long, slow drop back to a somewhat higher plateau than the previous cycle’s.
The introduction of spot Bitcoin exchange-traded funds (ETFs) appears to have disrupted the standard pattern a bit, pre-loading Bitcoin’s chart with a short-lived price increase in the spring of 2024. The 2024 election results also gave most crypto names an unusual price boost. Other than these events in the run-up to 2025, the leading cryptocurrency still looks ready for the usual price gains in the second year of each halving turn.
You didn’t come here for the math, and I can’t blame you for distrusting Bitcoin’s charting patterns. Technical analysis is more performance art than financial science, and the chart-based musings above are kinda-sorta an example of that nonsense.
Then again, I’m also basing the discussion on more than the basic chart squiggles. There are reasons for Bitcoin’s four-year cyclicality, because the economic model of producing more coins keeps changing at that pace. Every turn of the wheel is unique, as the economic environment around the crypto sector keeps changing. Still, the halving events make a real difference — hard to predict with pinpoint accuracy, but still useful as a guiding rule of thumb.
And after all of that, I’m convinced that Bitcoin will recover from the recent price cuts. It could take a few months, and there may be more pain to come, but I’ll be shocked if the tide doesn’t turn in the second half of 2025.
This digital currency was designed as a secure long-term storage facility for monetary value, also known as wealth. Strategy(NASDAQ: MSTR) chairman and co-founder Michael Saylor will talk your ear off on that topic while turning every possible stone to buy more Bitcoin for the company. One of my college-age kids just started her investment journey with an early Roth IRA account, and about 2% of that portfolio holds a popular Bitcoin ETF.
I’m no Saylor-style Bitcoin maximalist, but a small amount of exposure to the original crypto name seems appropriate for most investors. Getting in below $85,000 per coin is a serious discount from just three months ago, making the cryptocurrency about 25% more interesting.
Before you buy stock in Bitcoin, consider this:
The Motley Fool Stock Advisor analyst team just identified what they believe are the 10 best stocks for investors to buy now… and Bitcoin wasn’t one of them. The 10 stocks that made the cut could produce monster returns in the coming years.
Consider whenNetflixmade this list on December 17, 2004… if you invested $1,000 at the time of our recommendation,you’d have $469,399!* Or when Nvidiamade this list on April 15, 2005… if you invested $1,000 at the time of our recommendation,you’d have $590,231!*
Now, it’s worth notingStock Advisor’s total average return is731% — a market-crushing outperformance compared to146%for the S&P 500. Don’t miss out on the latest top 10 list, available when you joinStock Advisor.