
-
AppLovin shares surged Thursday after the mobile app marketing provider announced the sale of its mobile game business and quarterly results that topped Wall Street expectations.
-
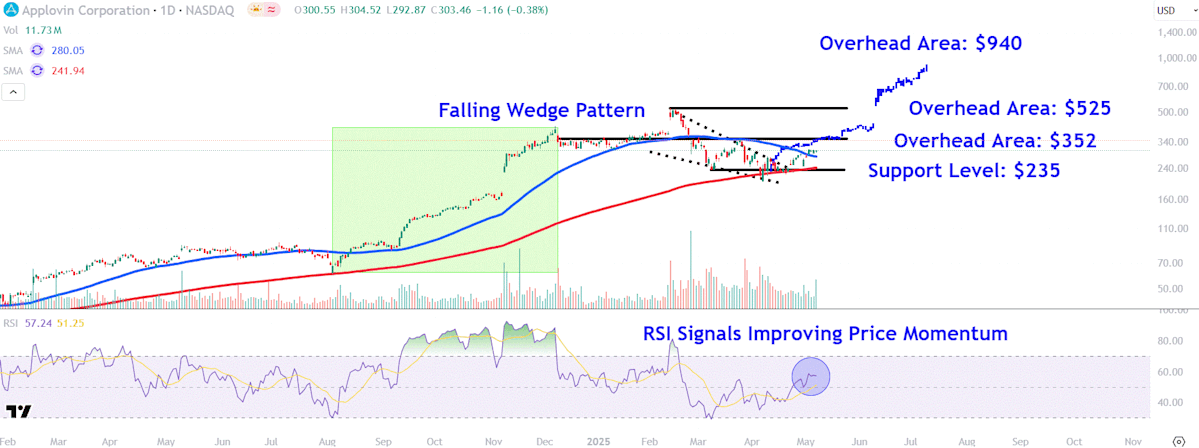
The stock has recently broken out above a falling wedge pattern and reclaimed the 50-day moving average.
-
Investors should watch crucial overhead areas on AppLovin’s chart around $352, $525 and $940, while also monitoring an important support level near $235.
AppLovin (APP) shares surged Thursday after the mobile app marketing provider announced the sale of its mobile game business and quarterly results that topped Wall Street expectations.
The company, which offers AI-powered software products to assist developers target ads and monetize apps, said late Wednesday it sold its mobile game unit to London-based Tripledot Studios for $400 million and will hold a 20% stake in the private firm following the transaction.
In addition to topping analysts’ first quarter earnings forecasts, the company issued current quarter advertising revenue guidance above expectations, while also pointing out that it focuses on mid-market web advertisers that have less exposure tariffs.
AppLovin shares tumbled as much as 62% between mid-February and early April after short sellers published reports accusing the adtech company of deceptive practices. The stock gained 12% to close Thursday at $339.51, and is up about 70% from last month’s low point.
Below, we break down the technicals on AppLovin’s chart and identify price levels that investors are likely watching.
After setting a record high in mid February, AppLovin shares staged a sharp reversal back to the 200-day moving average, where they traded mostly sideways since that time.
However, the stock recently broke out above a falling wedge pattern and reclaimed the 50-day moving average in a move that coincided with the relative strength index crossing back above the 50 threshold to signal improving price momentum.
Let’s take a closer look at three crucial overhead areas on AppLovin’s chart worth watching, while also identifying an important support level to monitor during potential pullbacks.
The first overhead area to watch sits around $352. The shares could encounter selling pressure at this level near a trendline that connects the March peak and the upper range of a consolidation period that formed on the chart throughout most of December and January.
A decisive breakout above this area could see the shares climb to $525. Investors who have averaged in at lower prices may decide to lock in profits in this region near the stock’s record high.